Using EpiGraphDB Web UI
The EpiGraphDB web app offers a simple way for users to glimpse the key results of the integrative epidemiological evidence in the EpiGraphDB database.
Please visit the pages for individual topics to see their own functionalities. Here we discuss the major components of the user interface of the web app.
Home page
This is the home page of the web app, where each card in the home page leads you to further detail views.
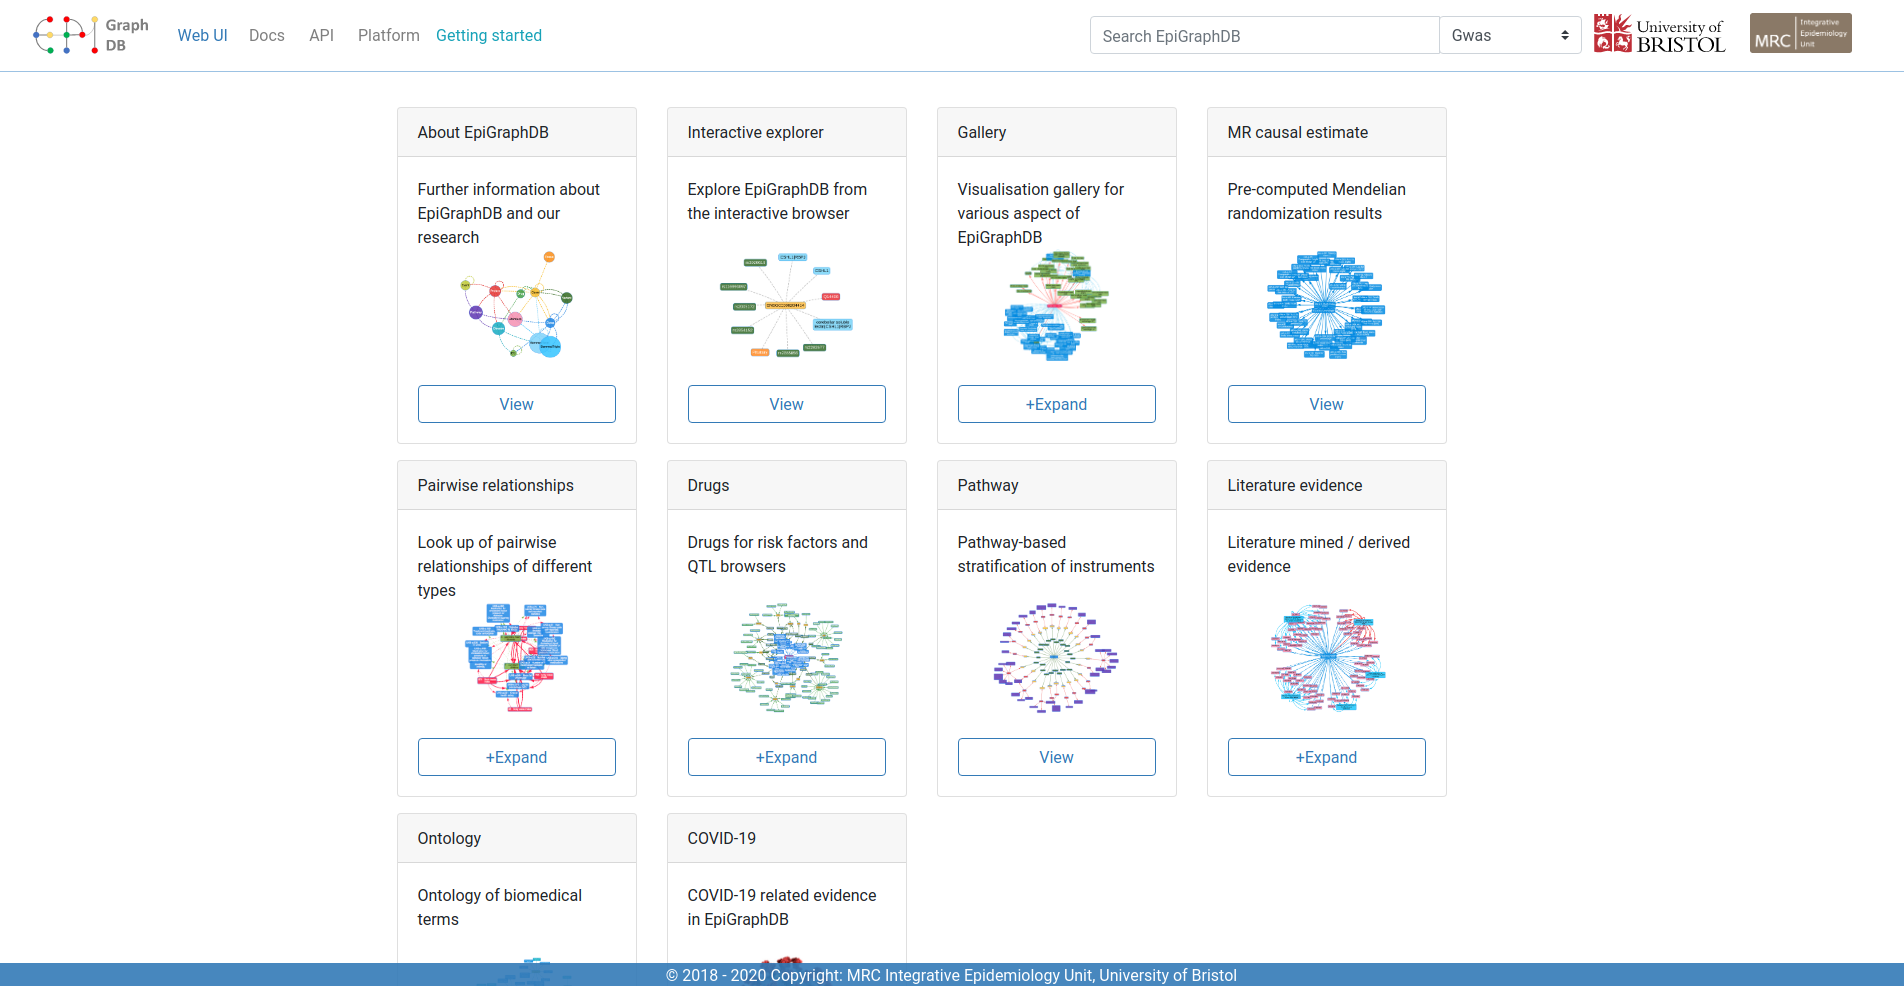
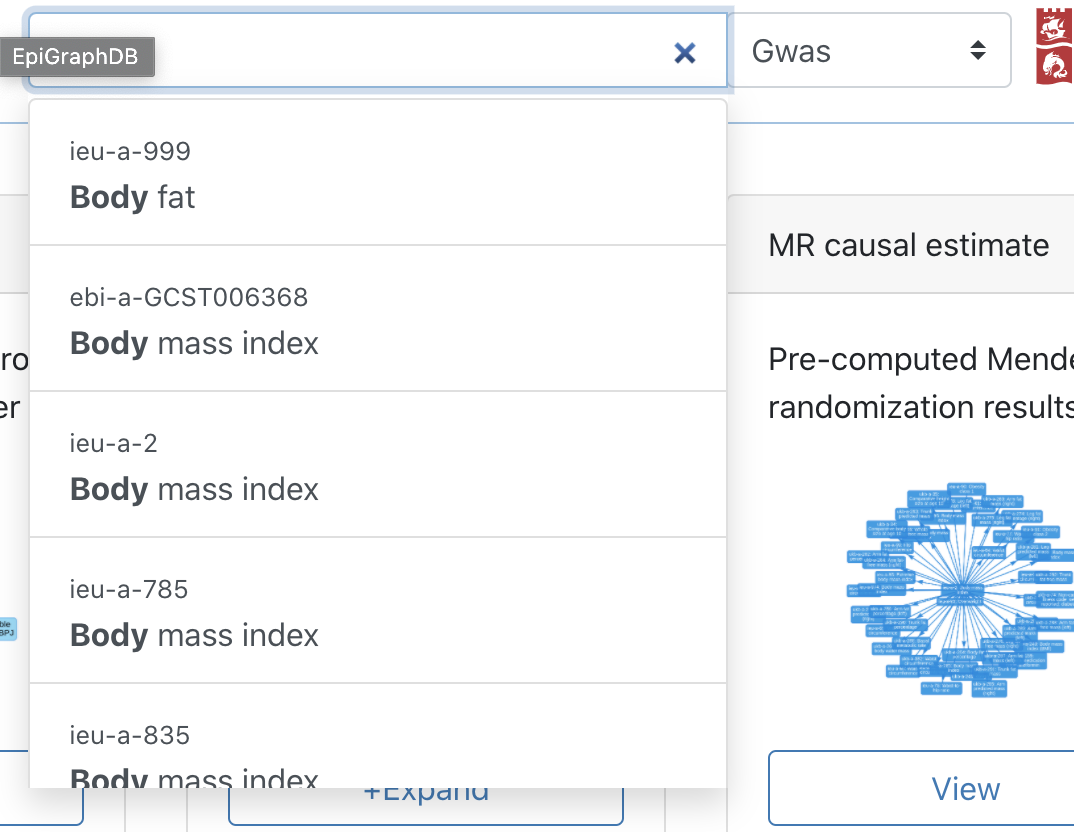
Use the search bar to search for entities, which will redirect user to the interactive browser.
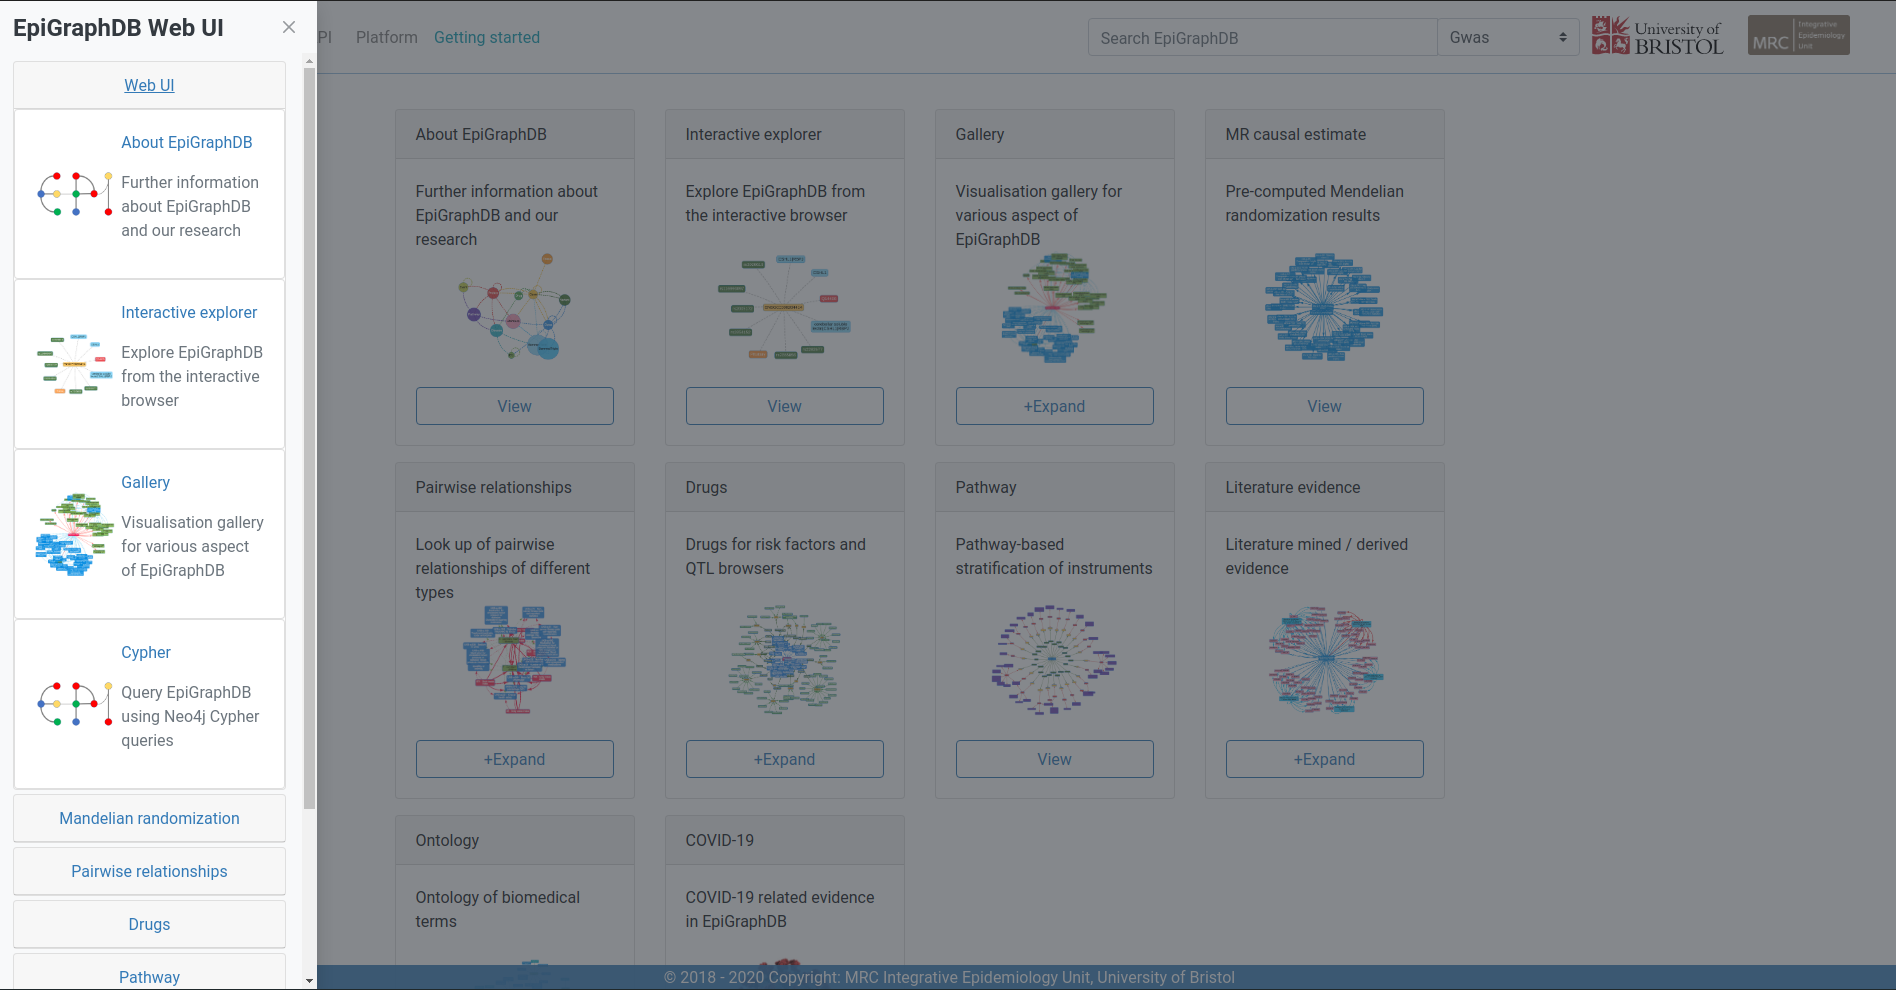
Click on the "Web UI" button and a sidebar will show up.
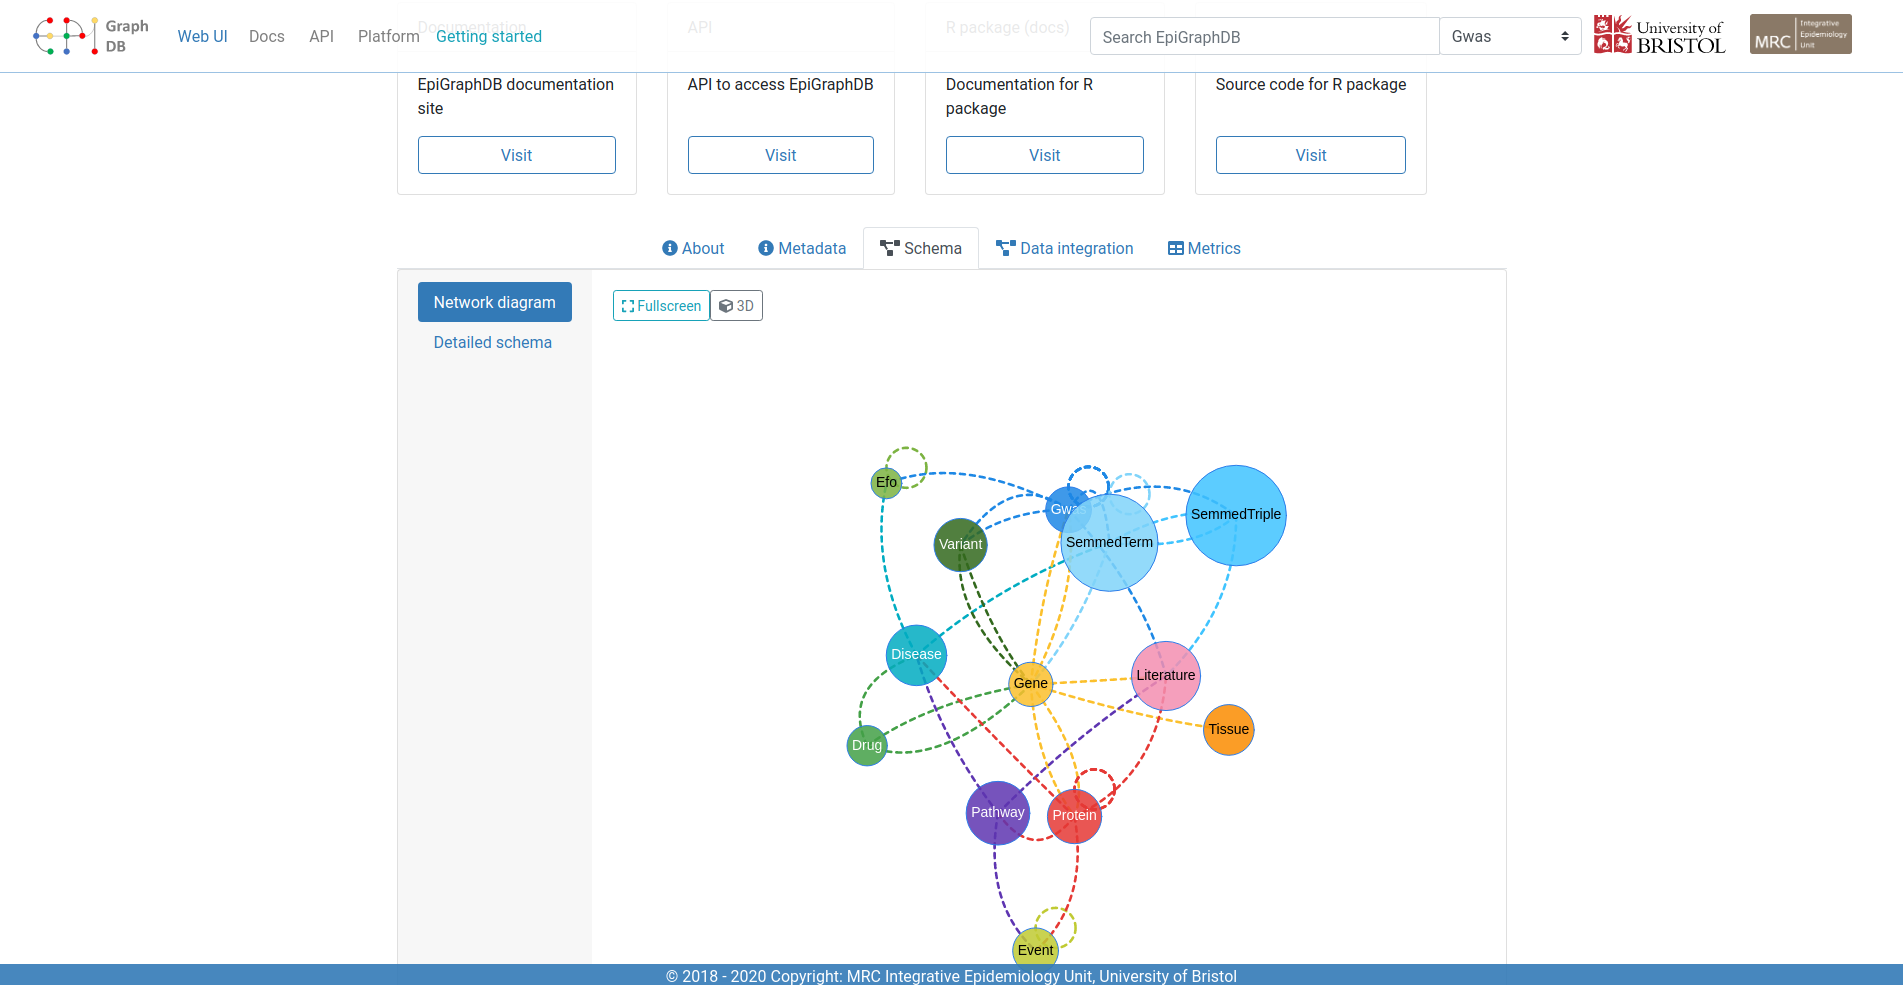
About page
The about page shows the overall information of EpiGraphDB, the schema of the graph database, as well as metadata metrics.
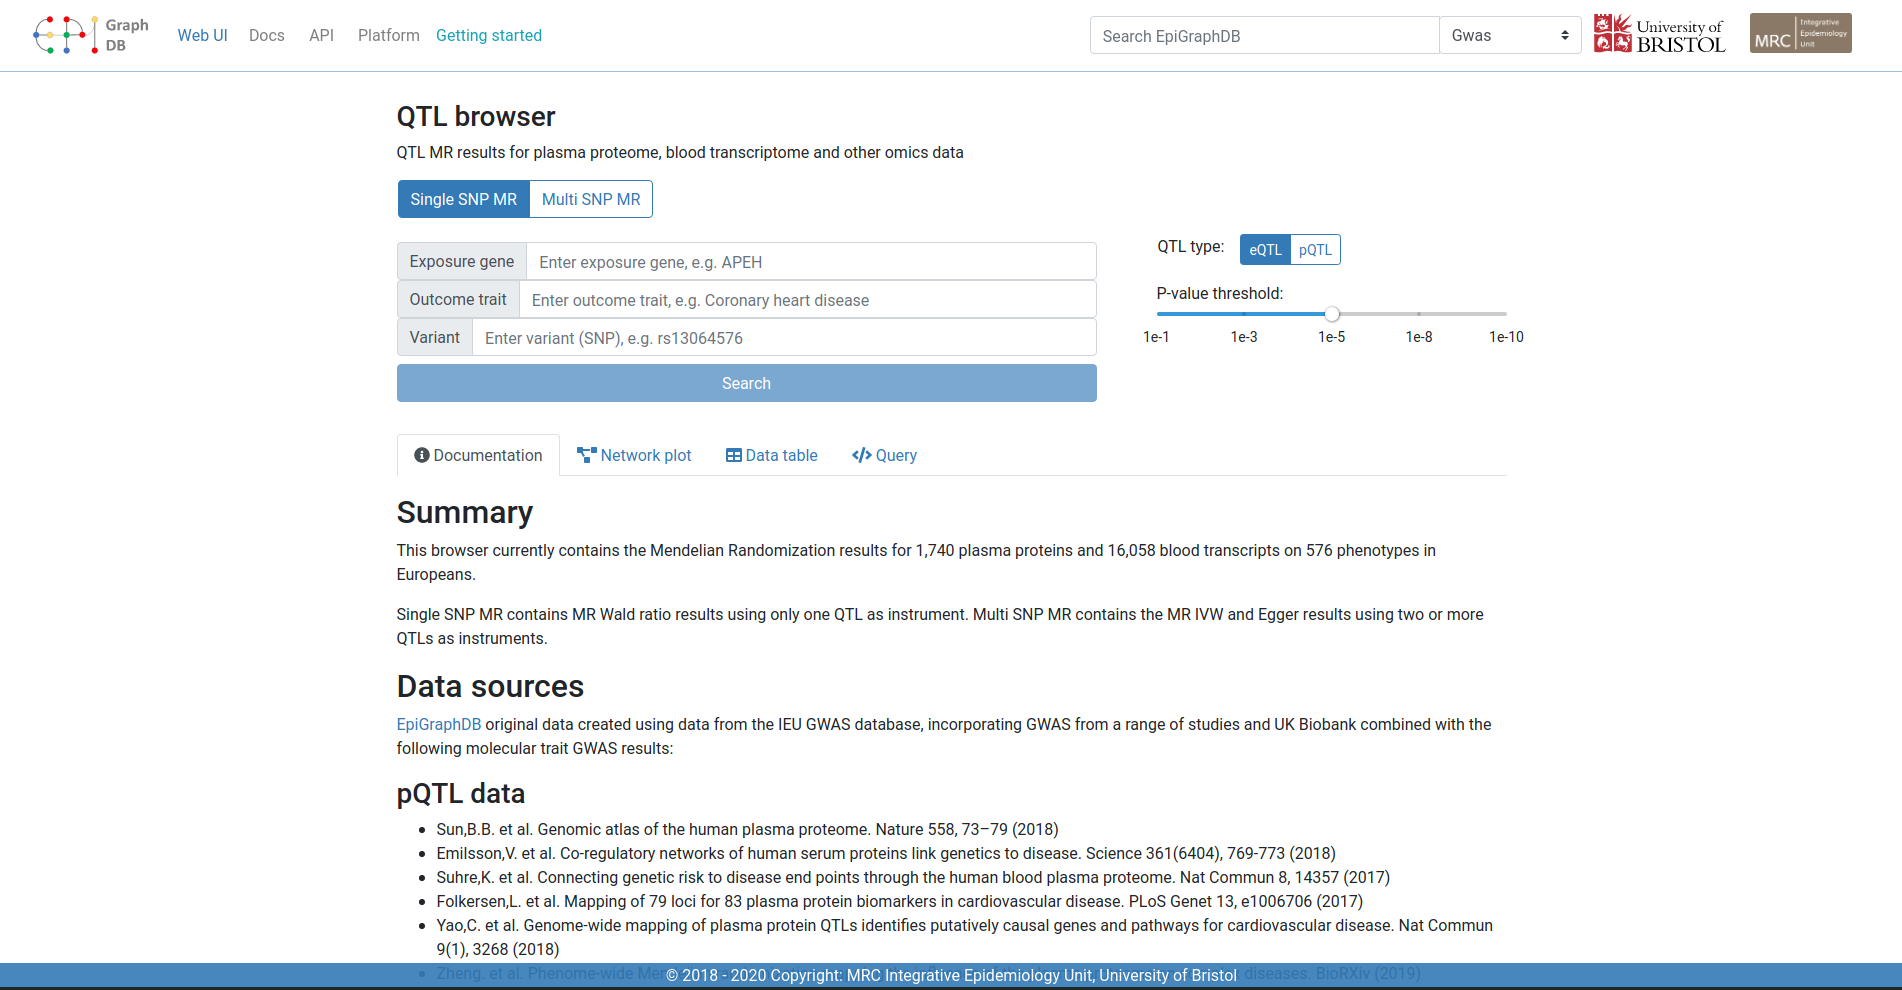
Individual topic page
Documentation
The documentation tab page is the default view that describes the general overview of the topic, data sources and relevant studies.
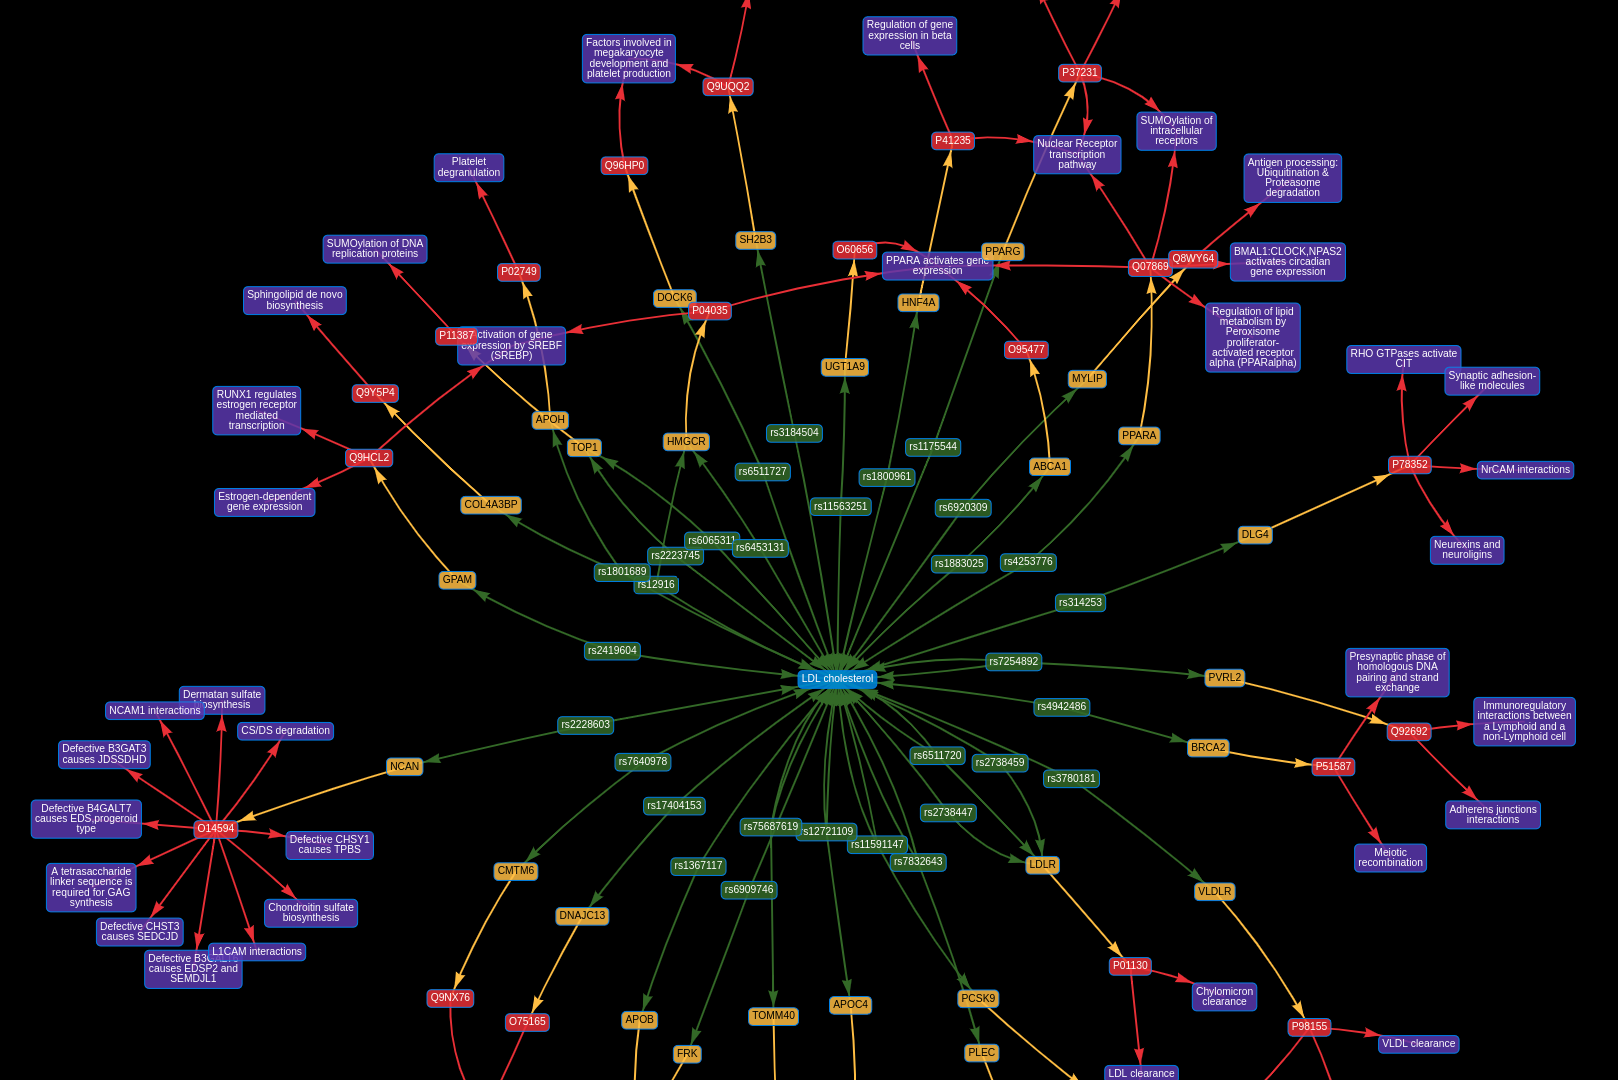
Network plot
The network plot offers a succinct way to visualise the complex epidemiological relationships.
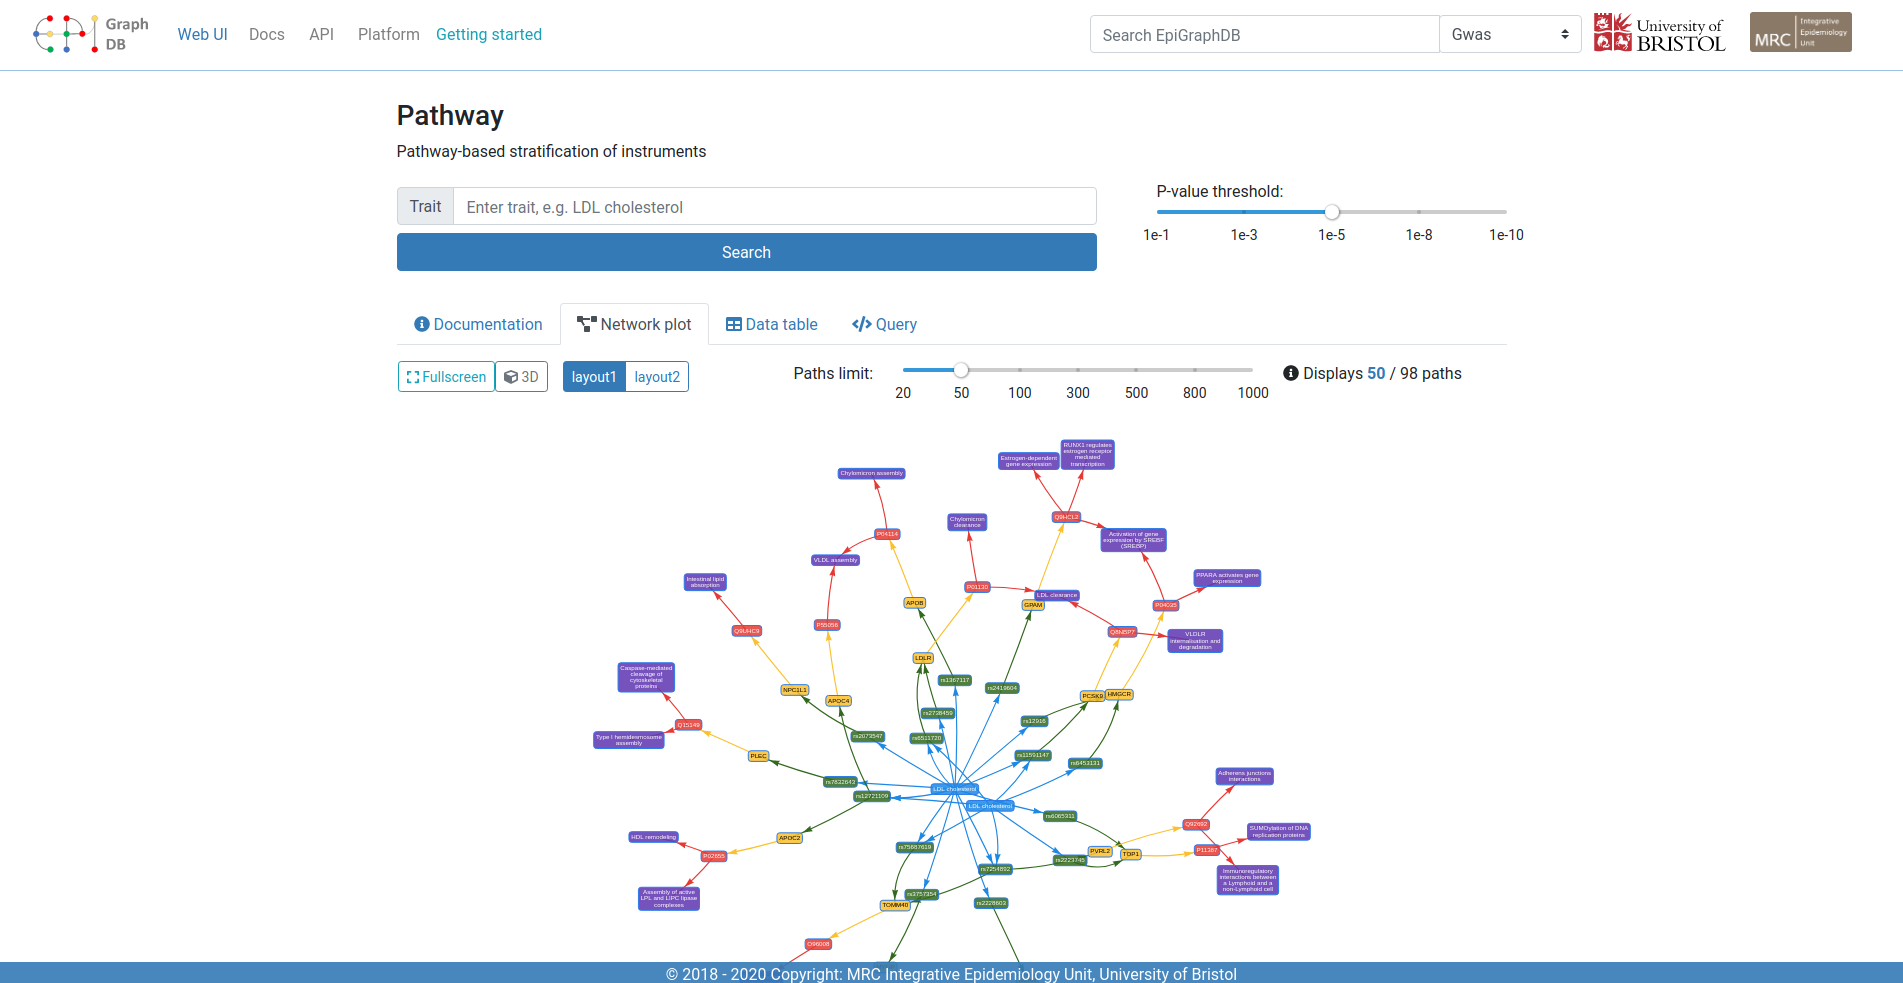
You can also toggle the fullscreen view to focus only on the network plot.
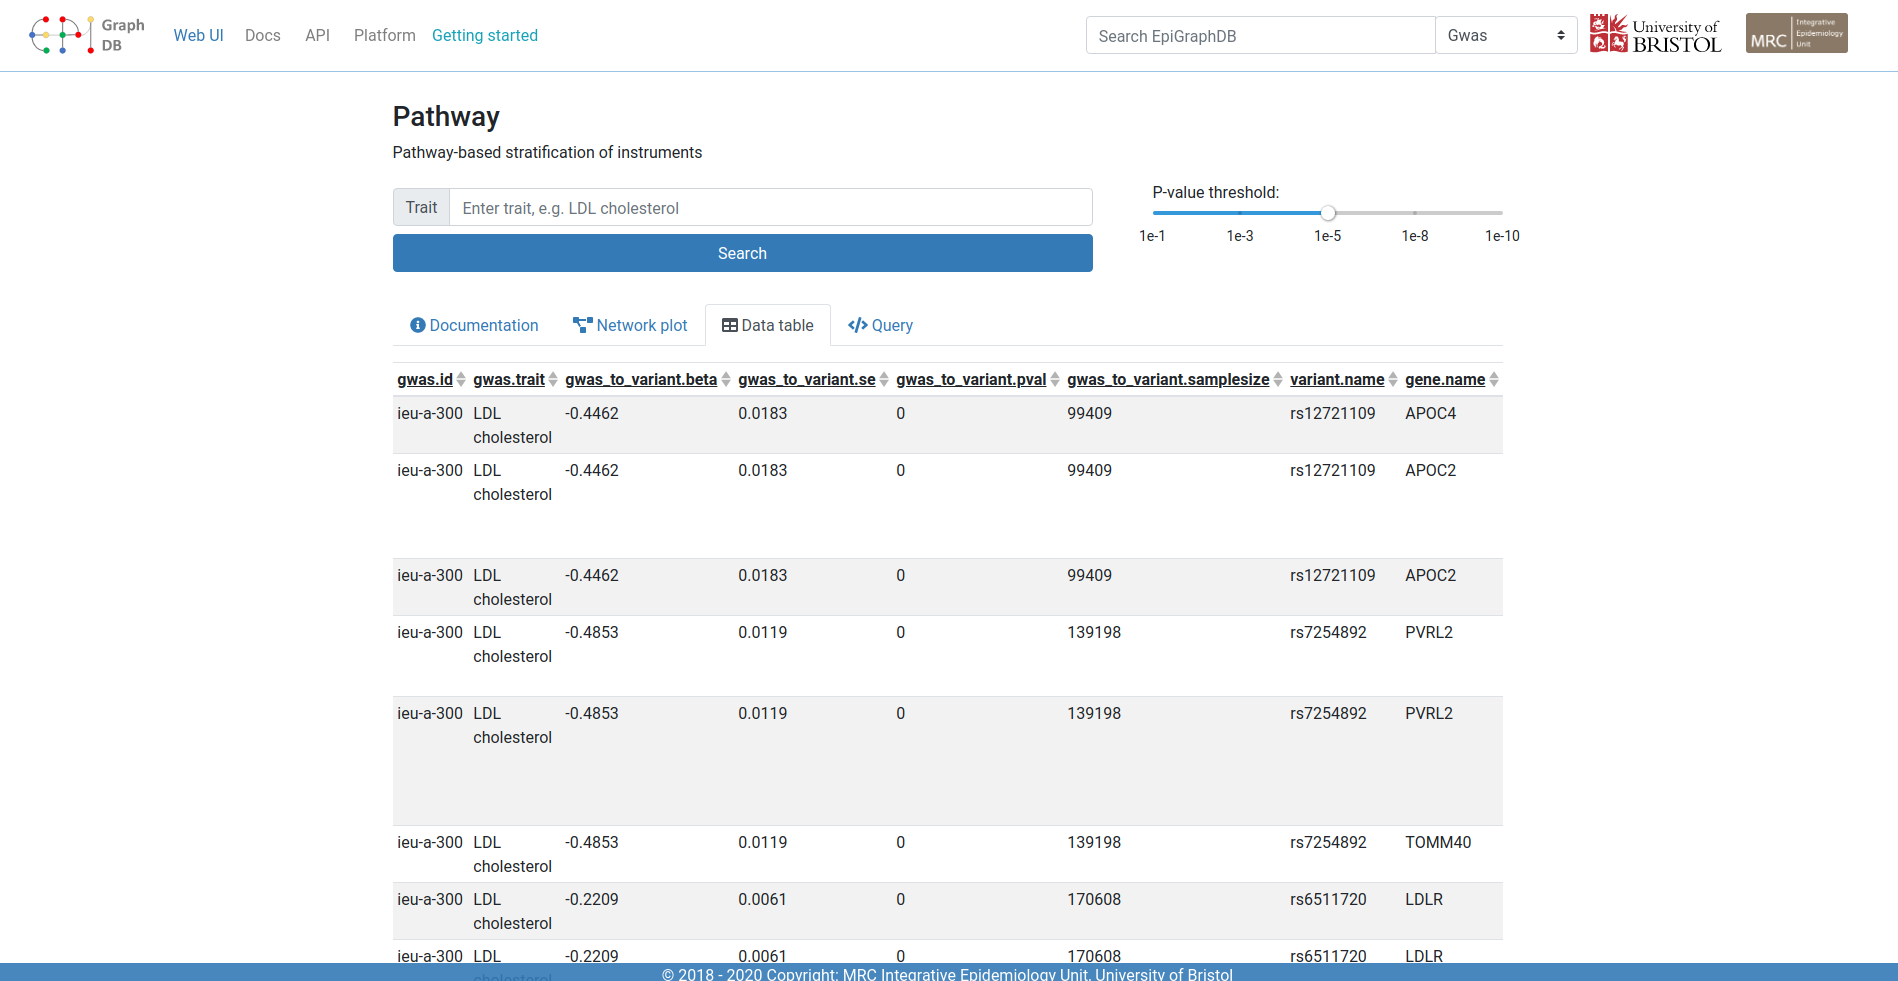
Data table
The table tab page renders the query results in a flattened tabular structure.
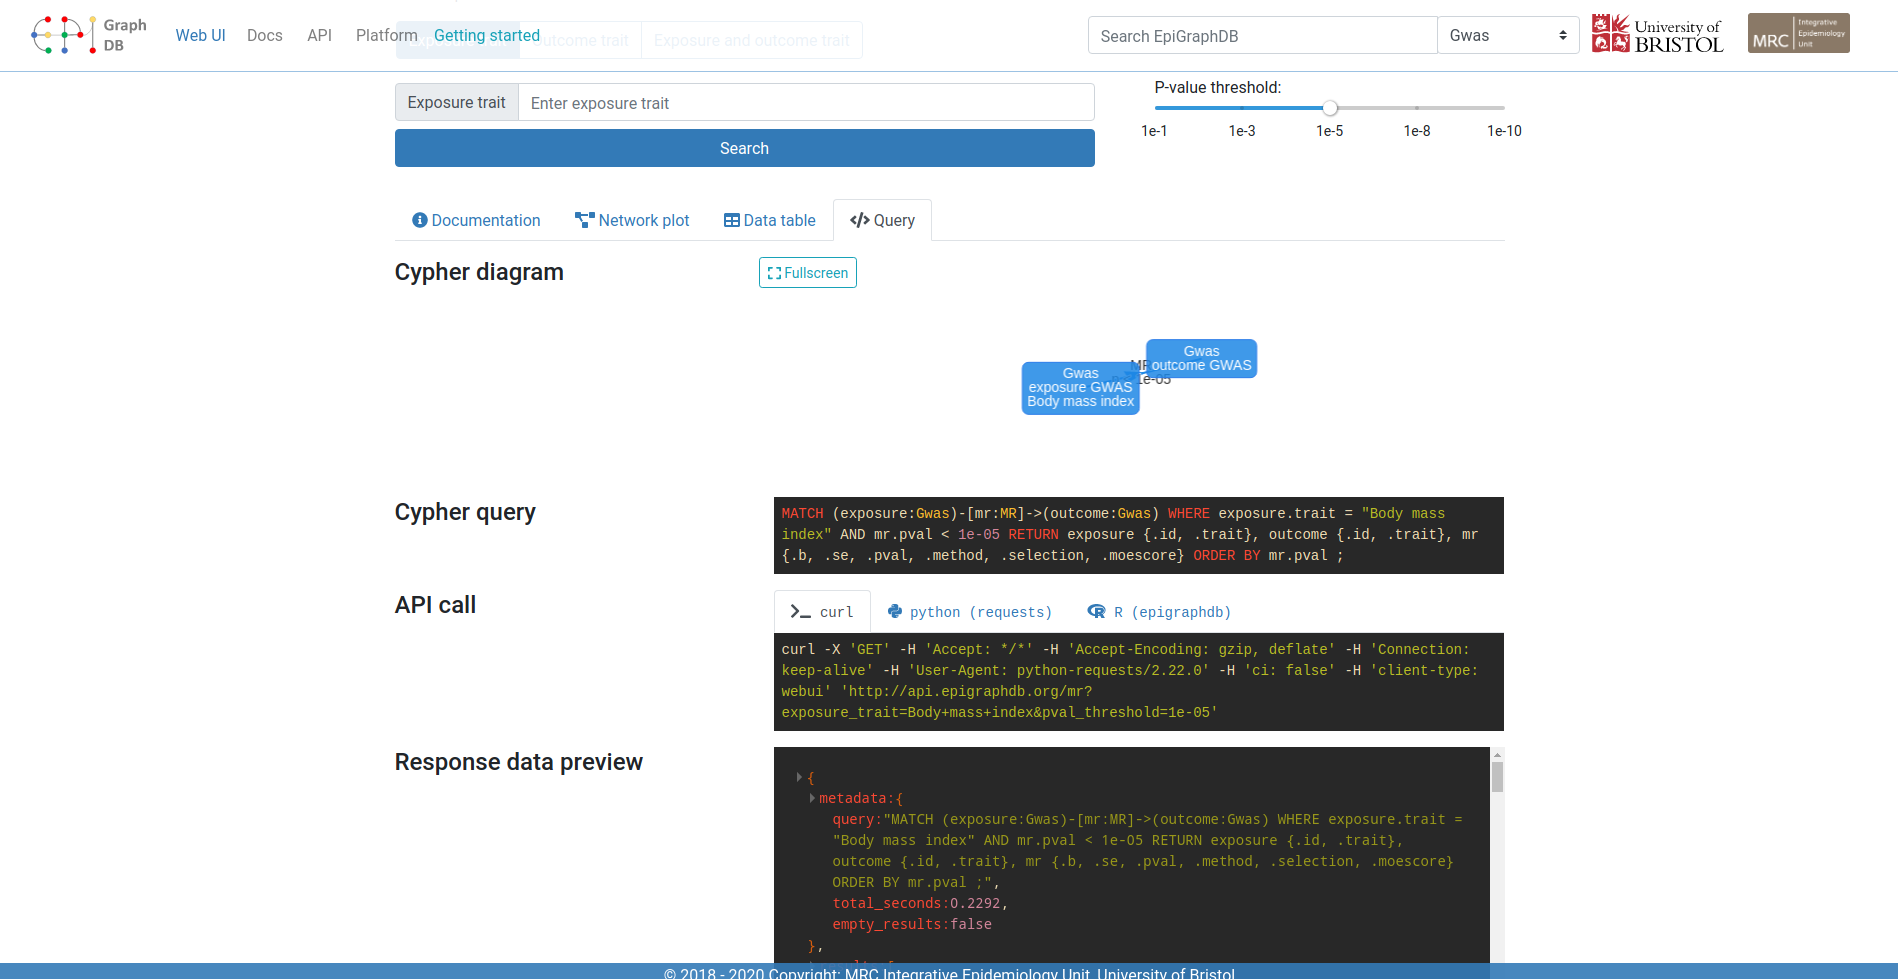
Query
The query tab page displays the structure of the query, the relevant API call, and the response data from the API. Based on the existing examples, you should be able to create your own queries to full utilise the rich resources in EpiGraphDB.
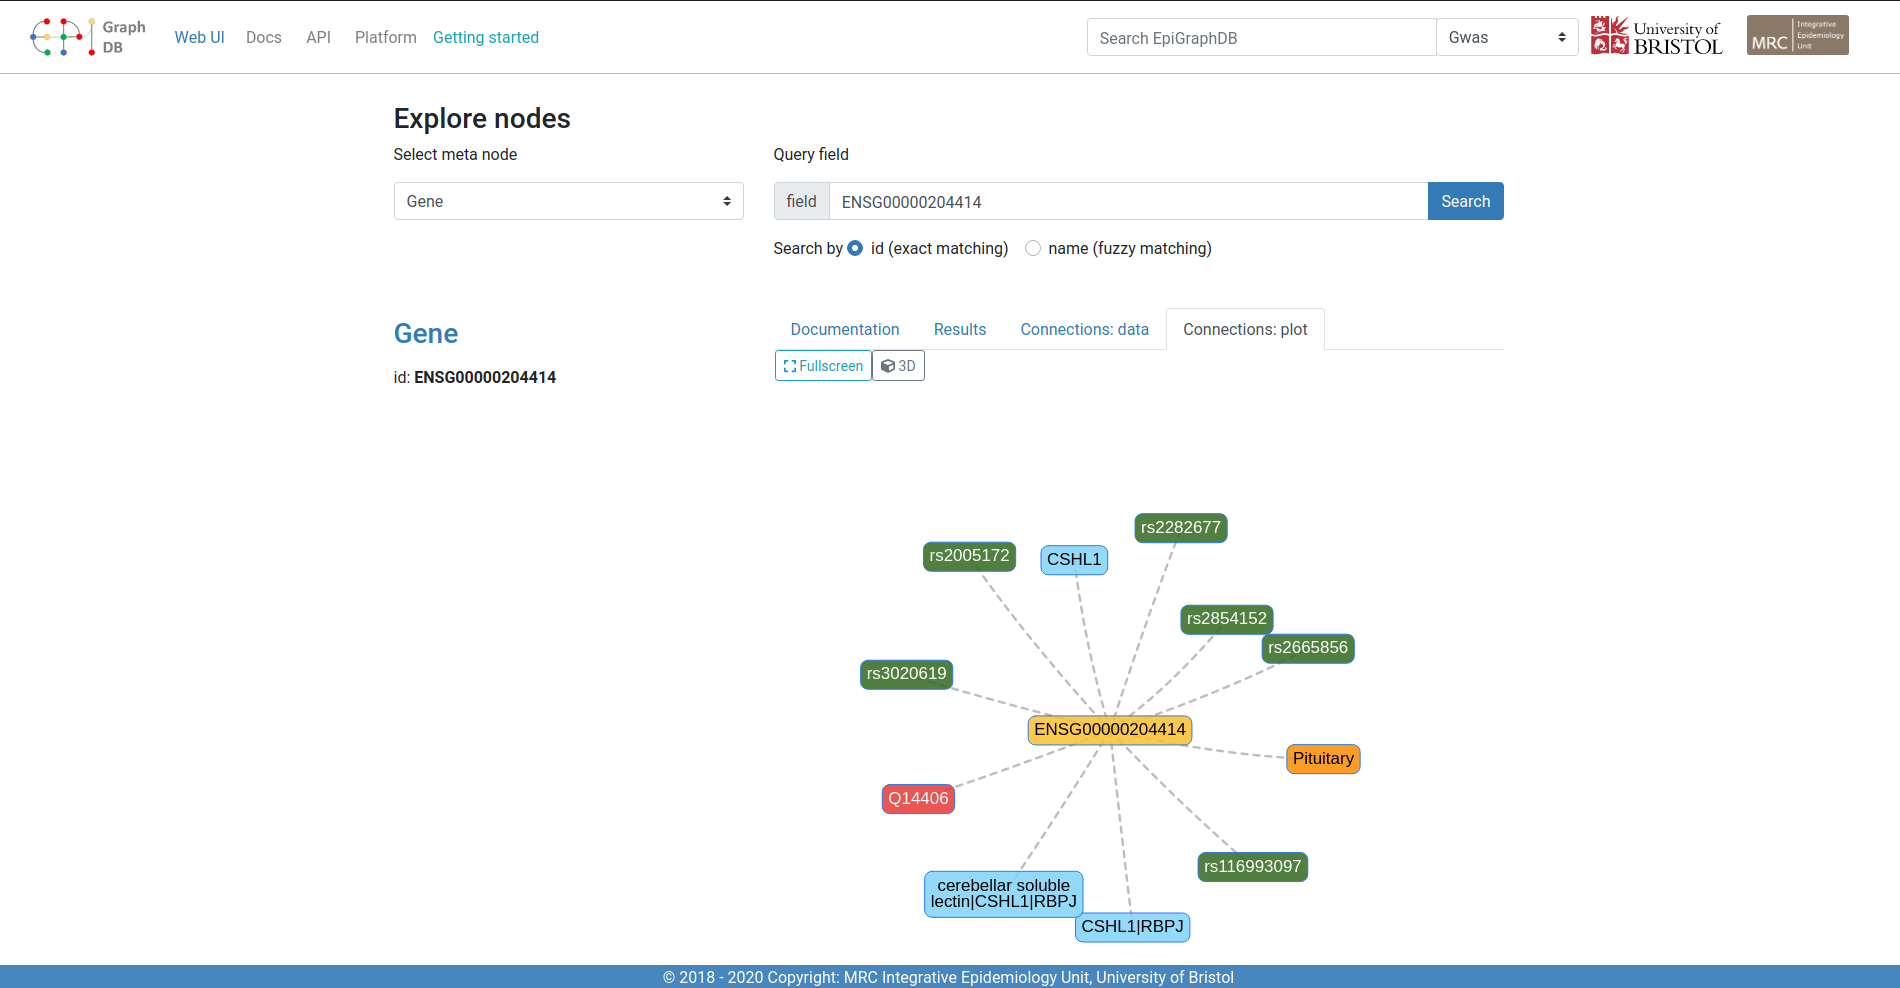
Interactive browser
You can use the interactive browser to explore the graph database.
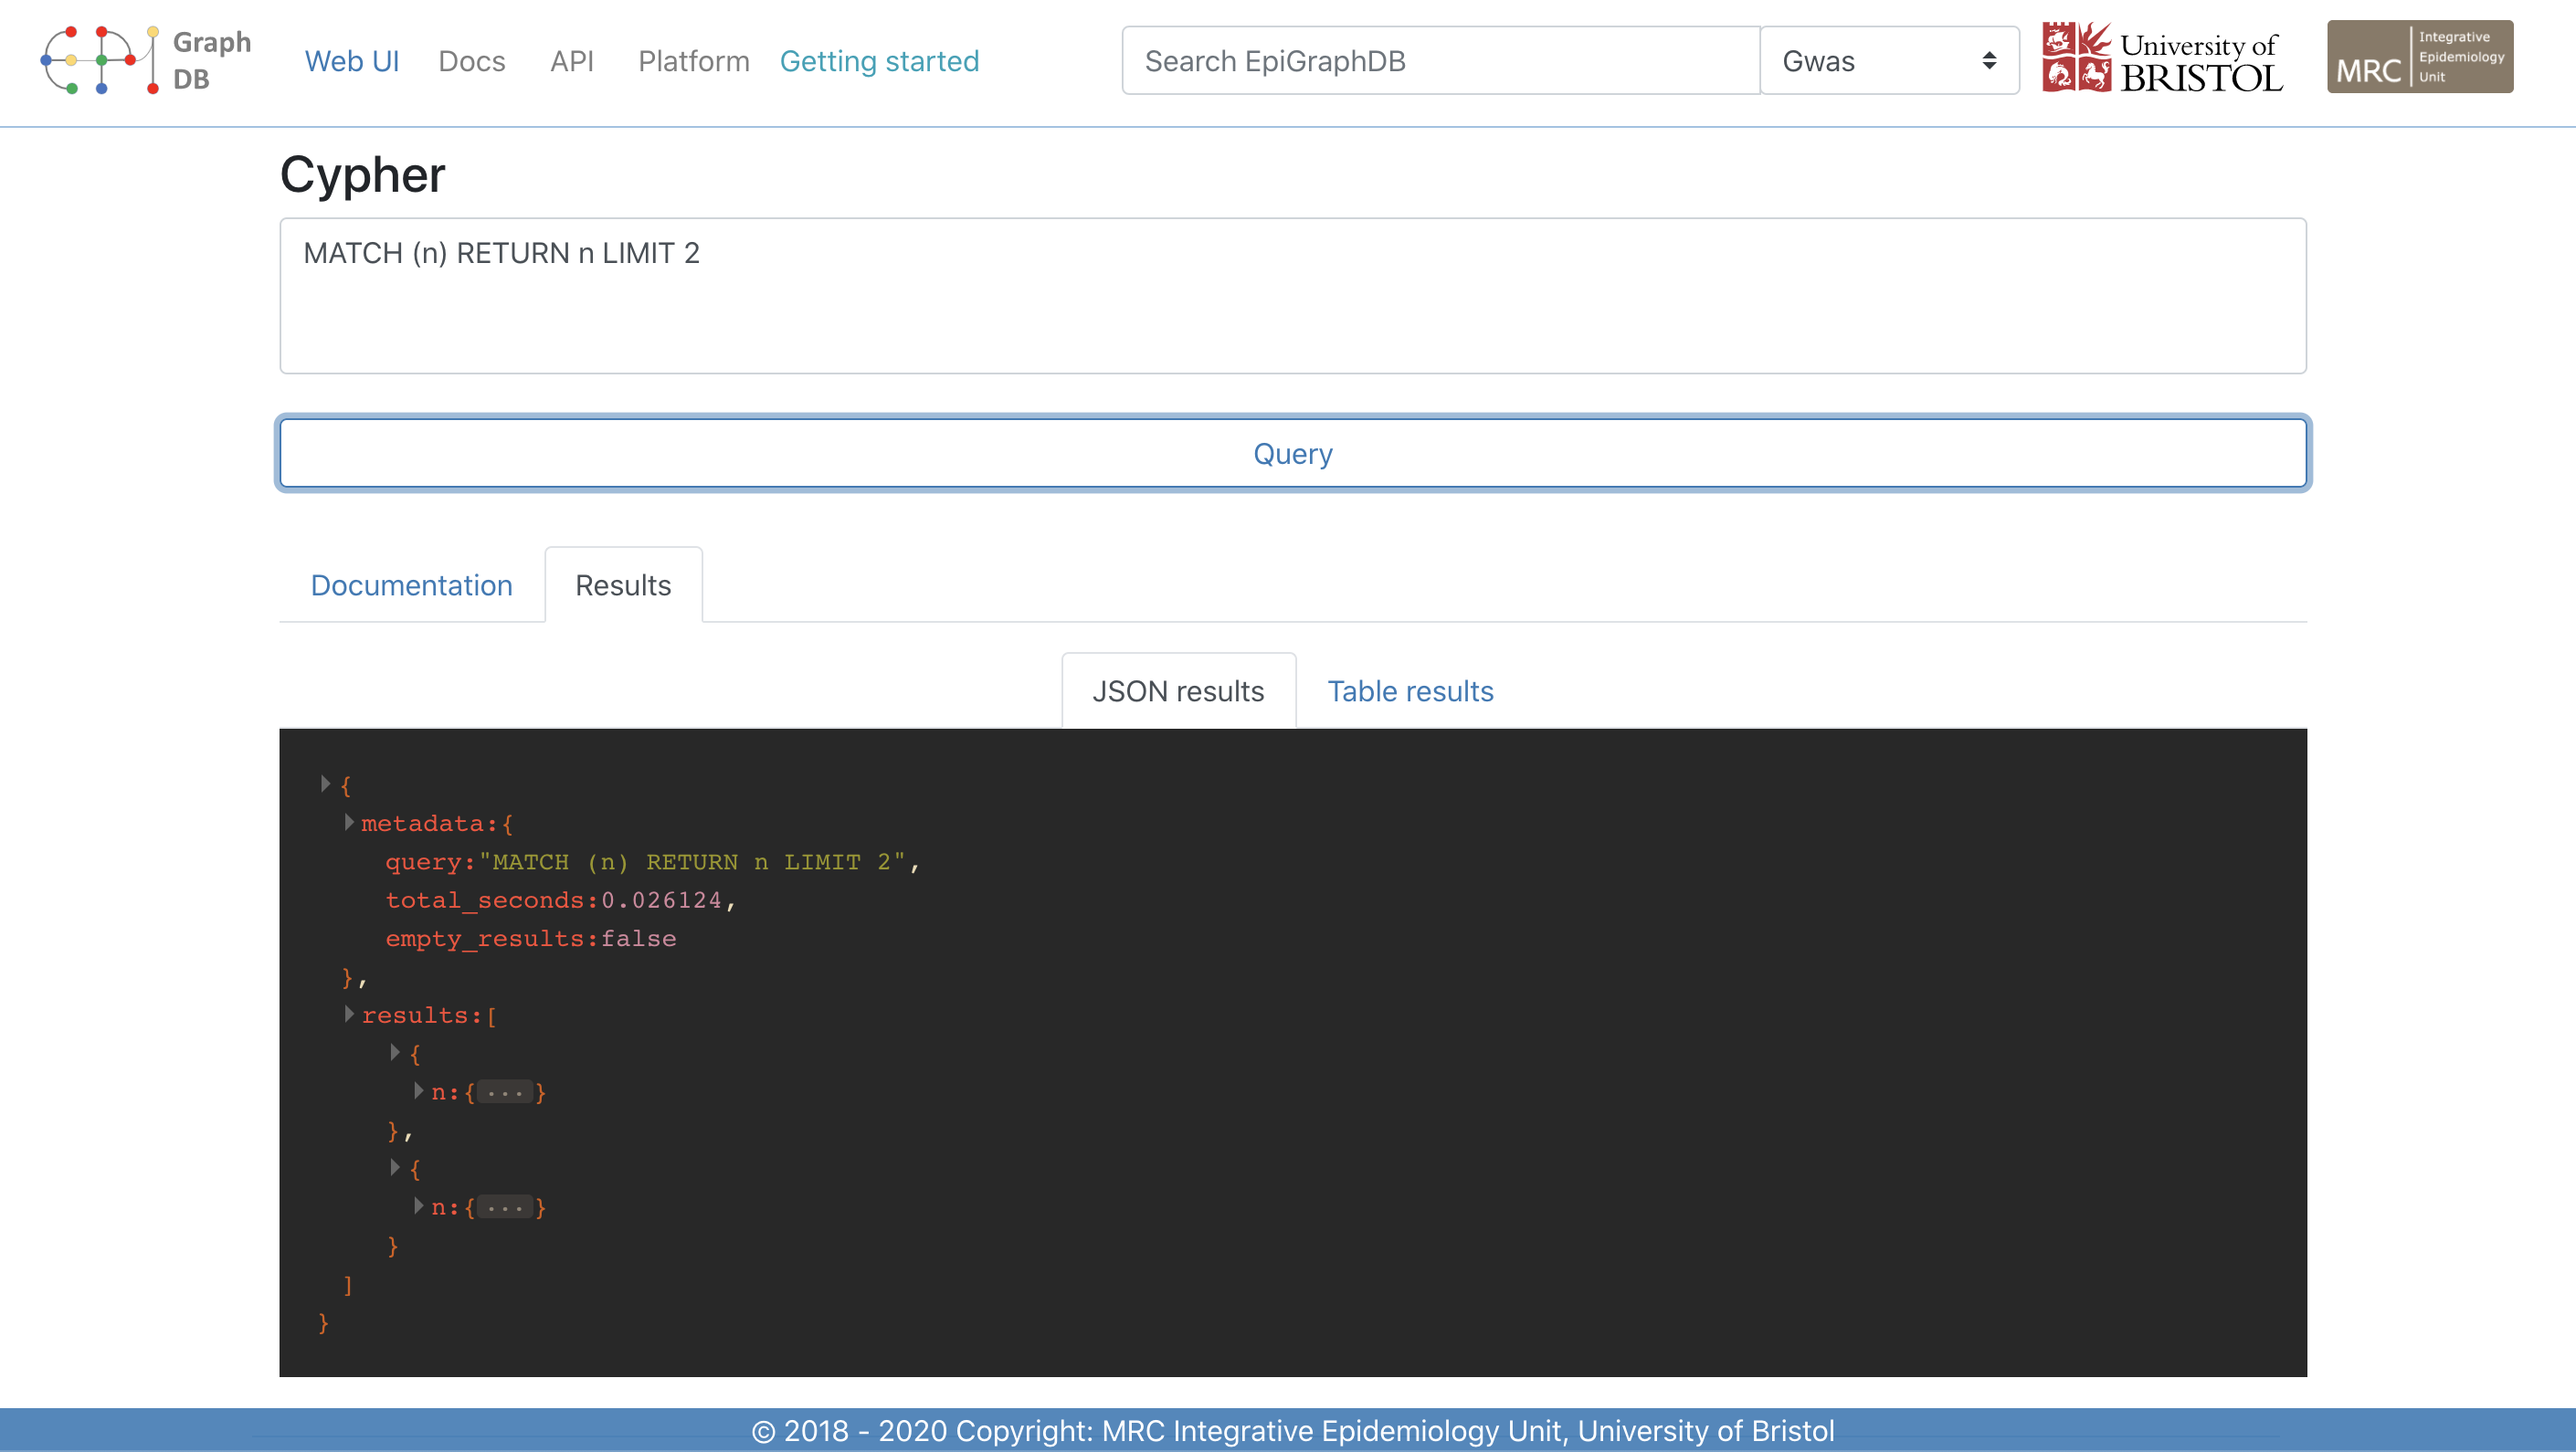
Cypher
Querying EpiGraphDB via Cypher (instead of standard REST endpoints) in the Web UI is possible.
Contact
Please get in touch with us for issues, comments, suggestions, etc. via the following methods: